Urur/ Olcott Kuppam Community Mapping- Step 2 and 3- creating rough maps and presenting it to the Kuppam

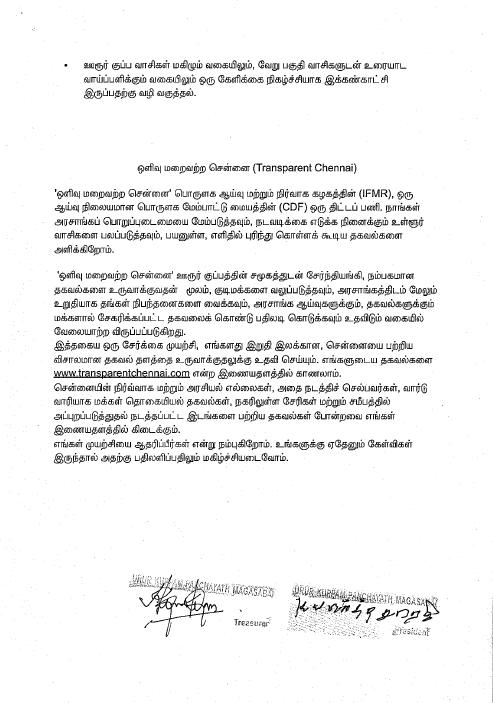
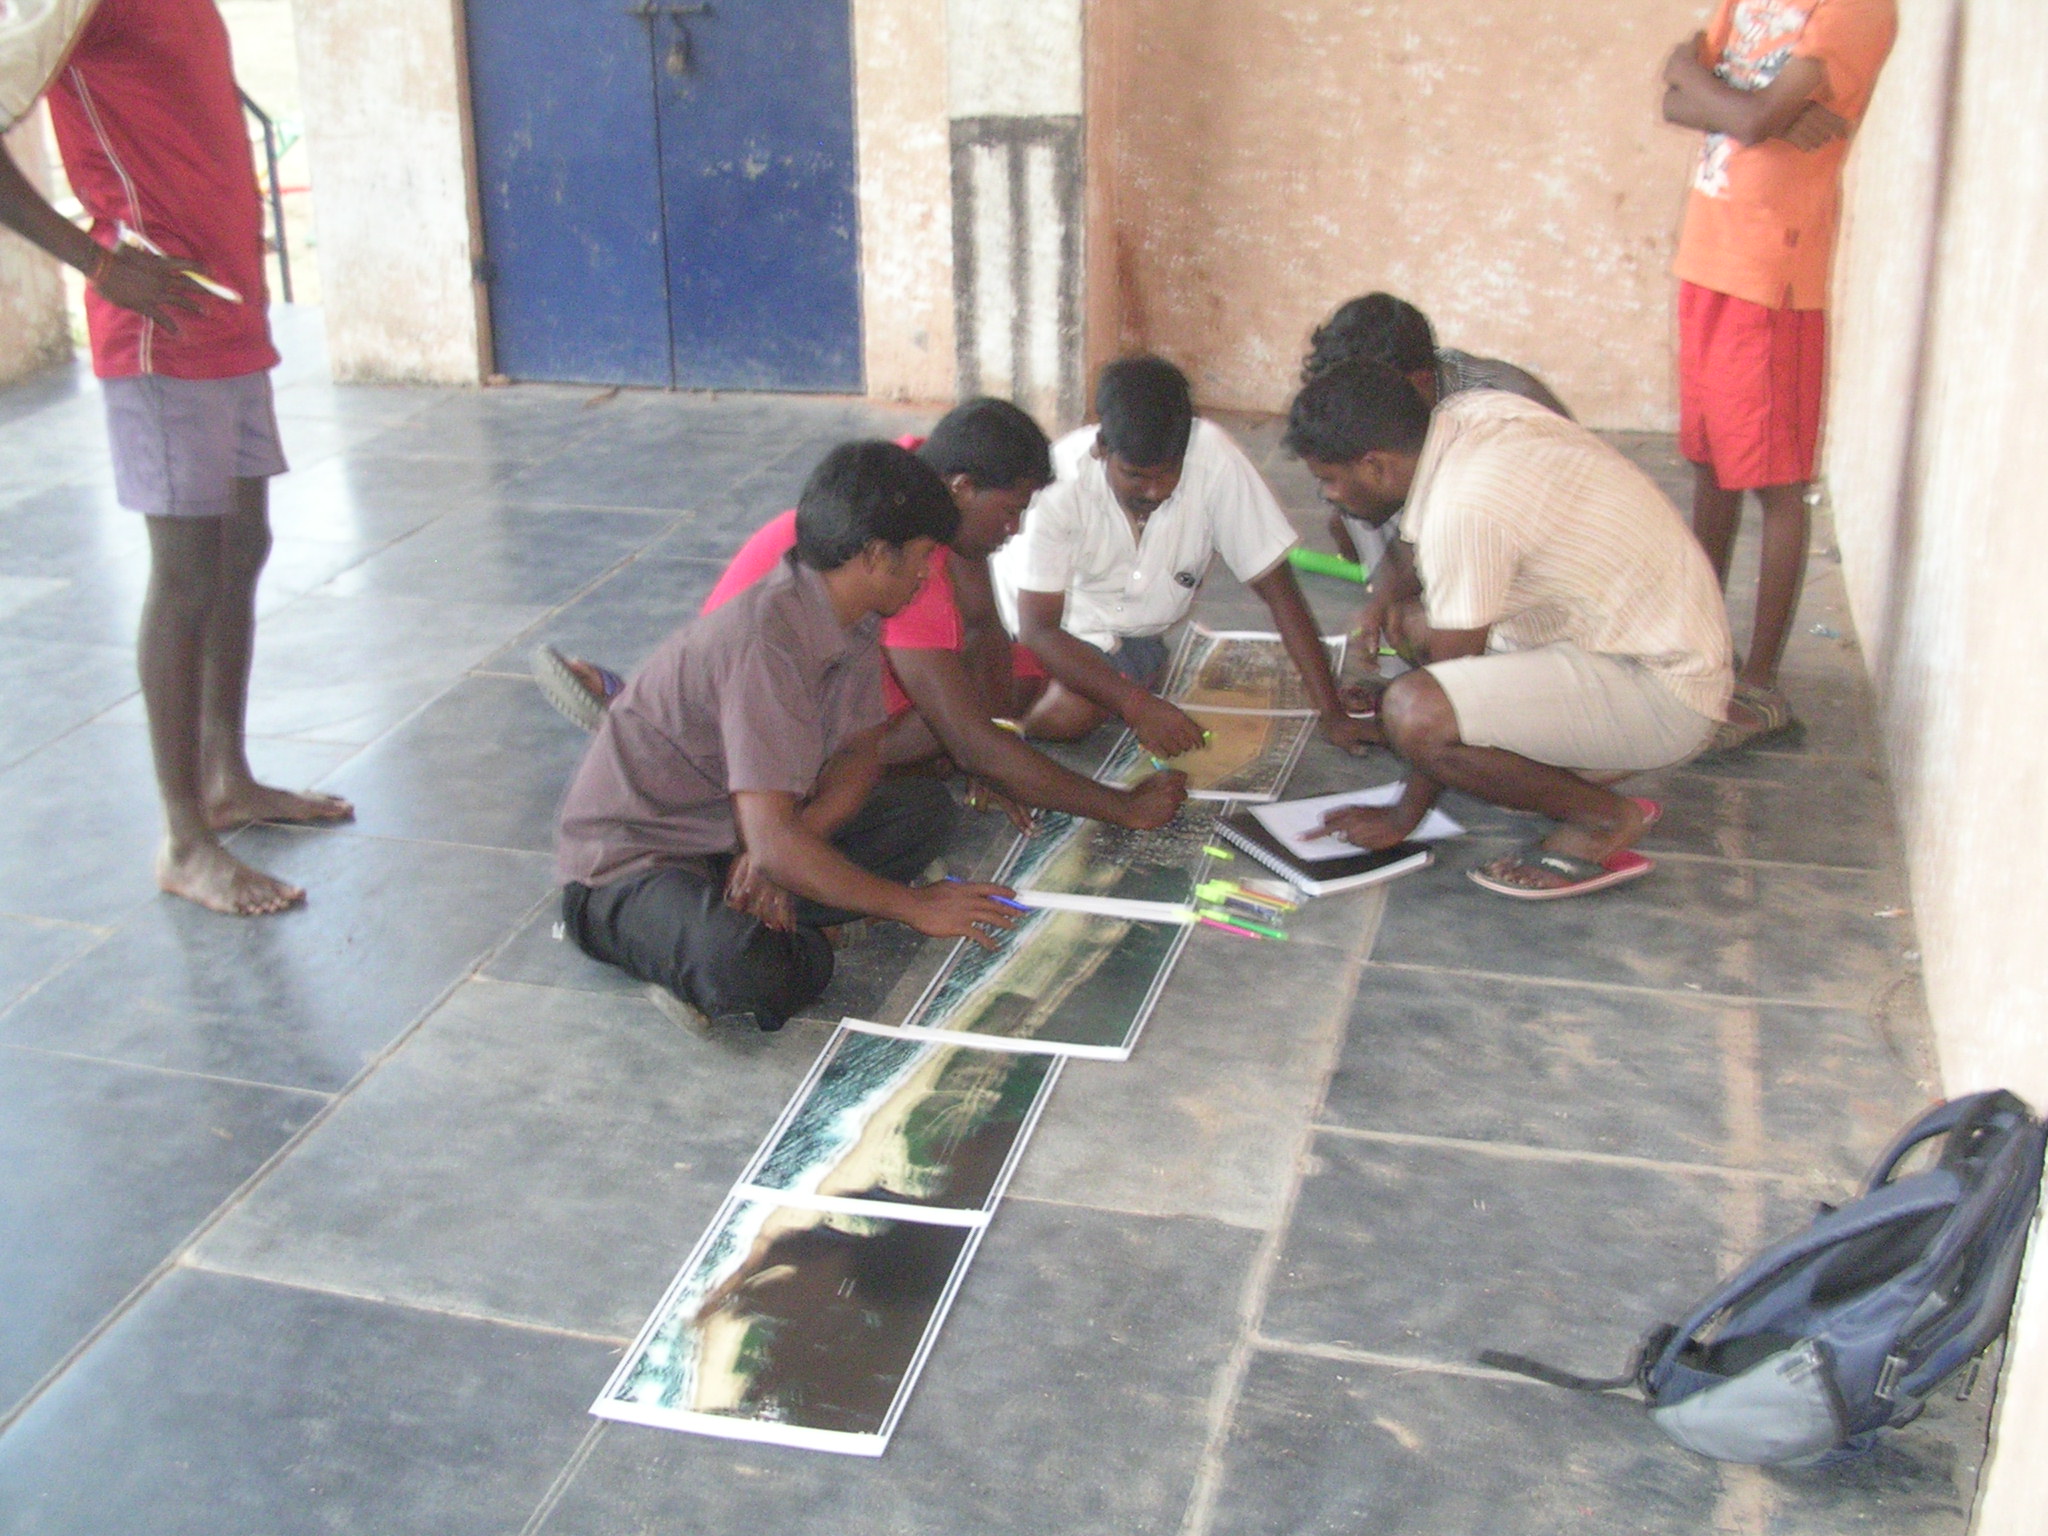
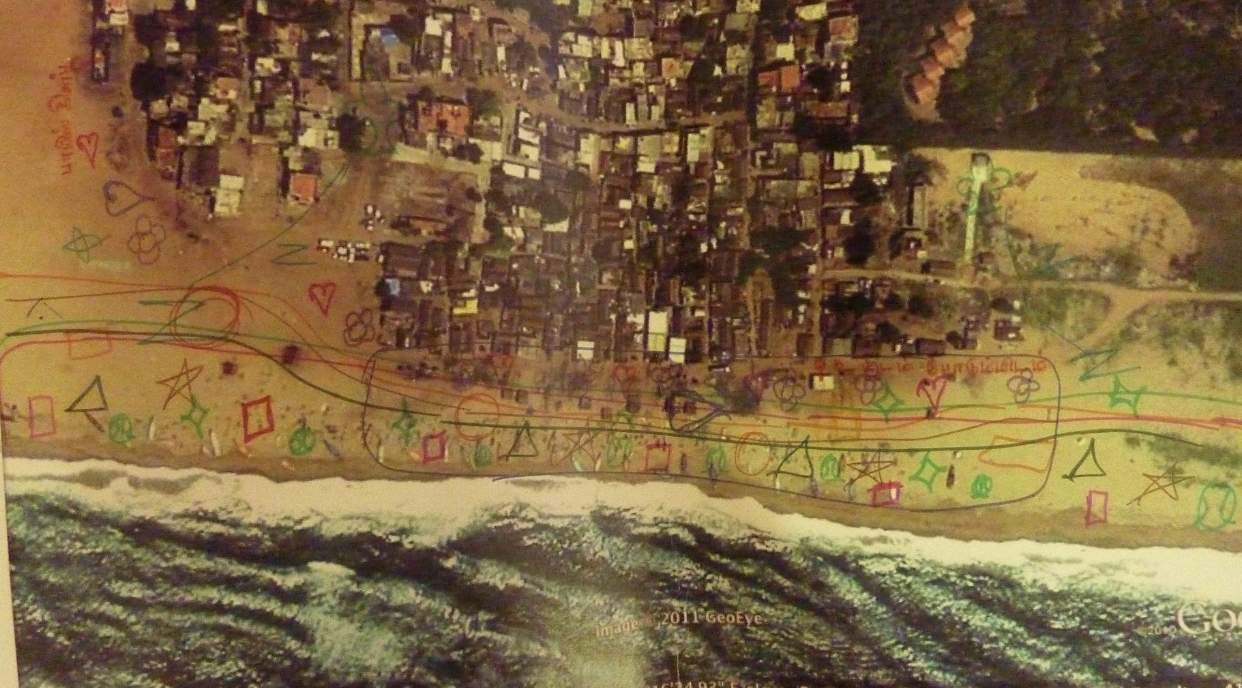
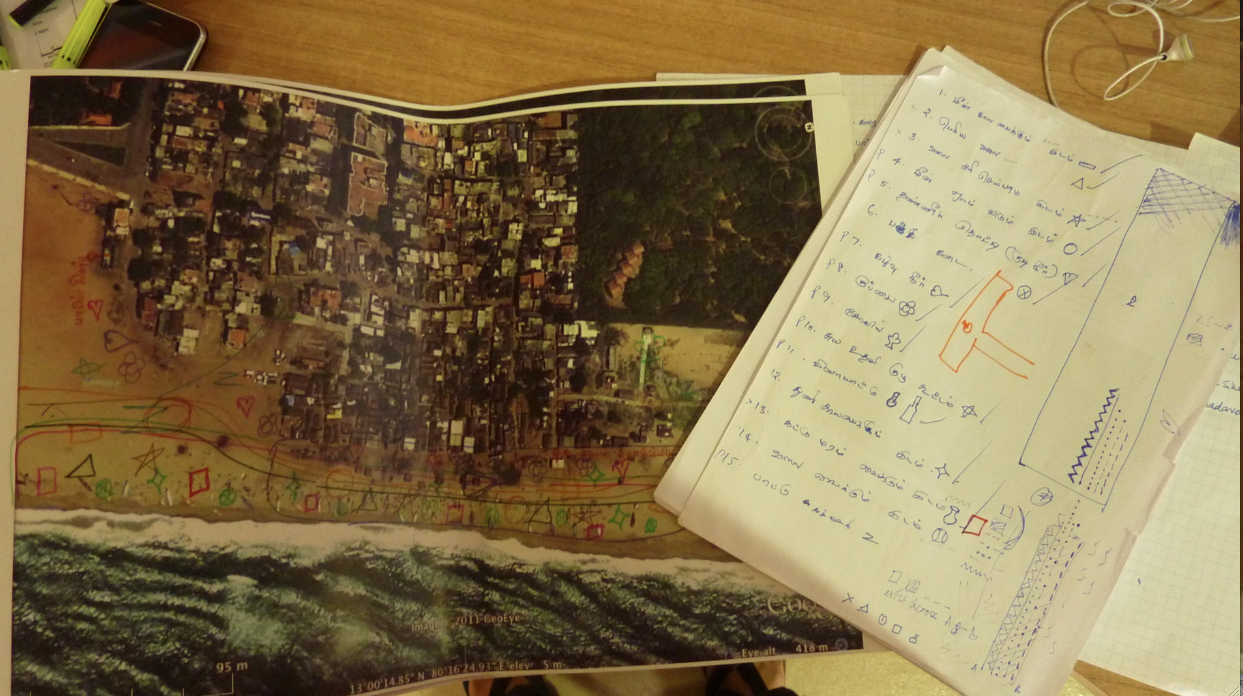
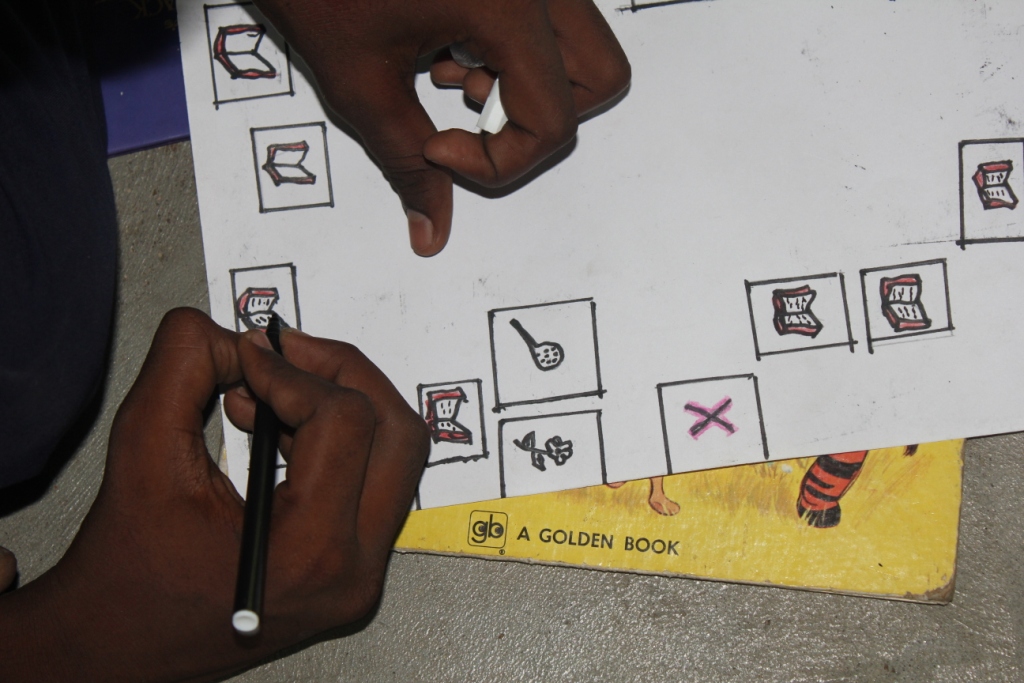
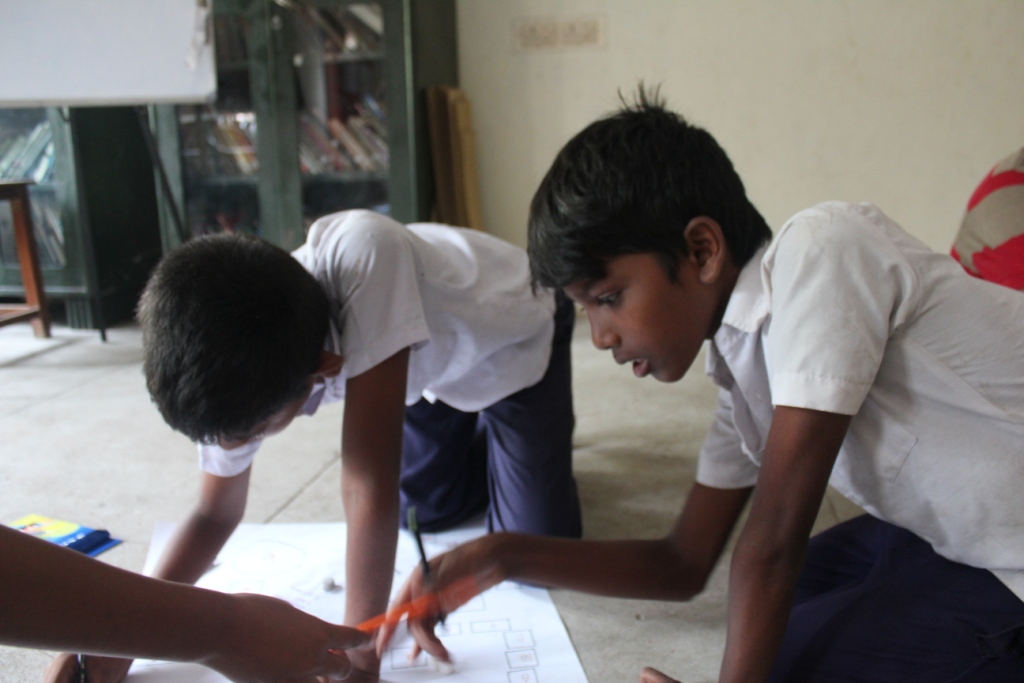
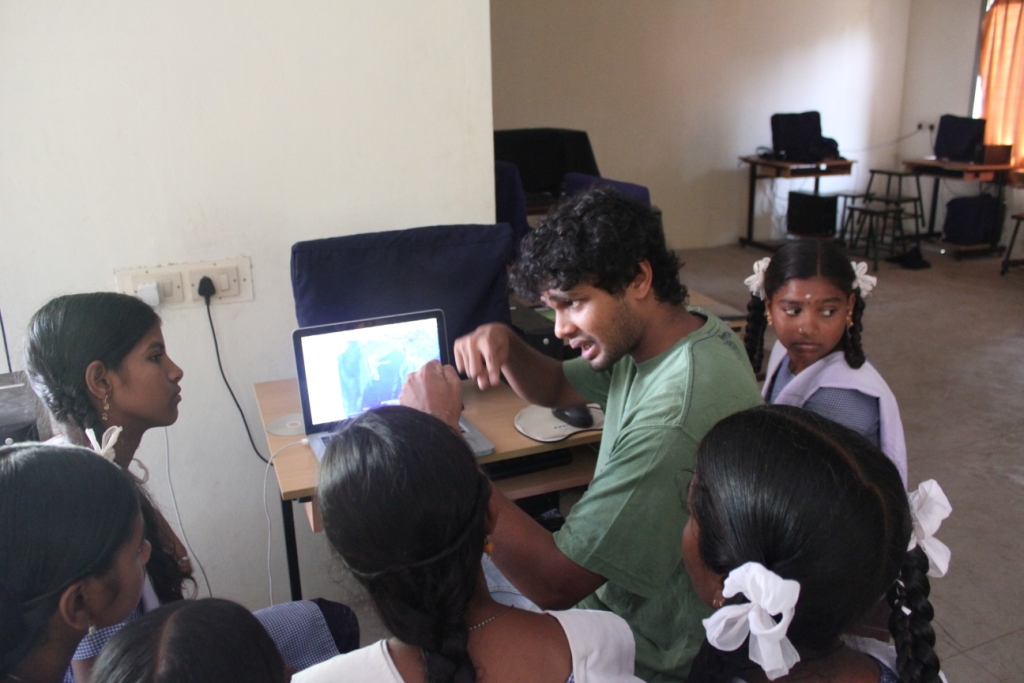
Once we collected the data that the fishermen had created using the paper google images, which pertained to how they used their space in terms of their livelihood, socio-cultural activities as well as the lack in infrastructure in the Kuppam, we went back to our office and created rough maps (https://rising.globalvoicesonline.org/chennai/2011/07/13/community-mapping-at-ururolcott-kuppam-step-1%E2%80%A6-in-pictures/).


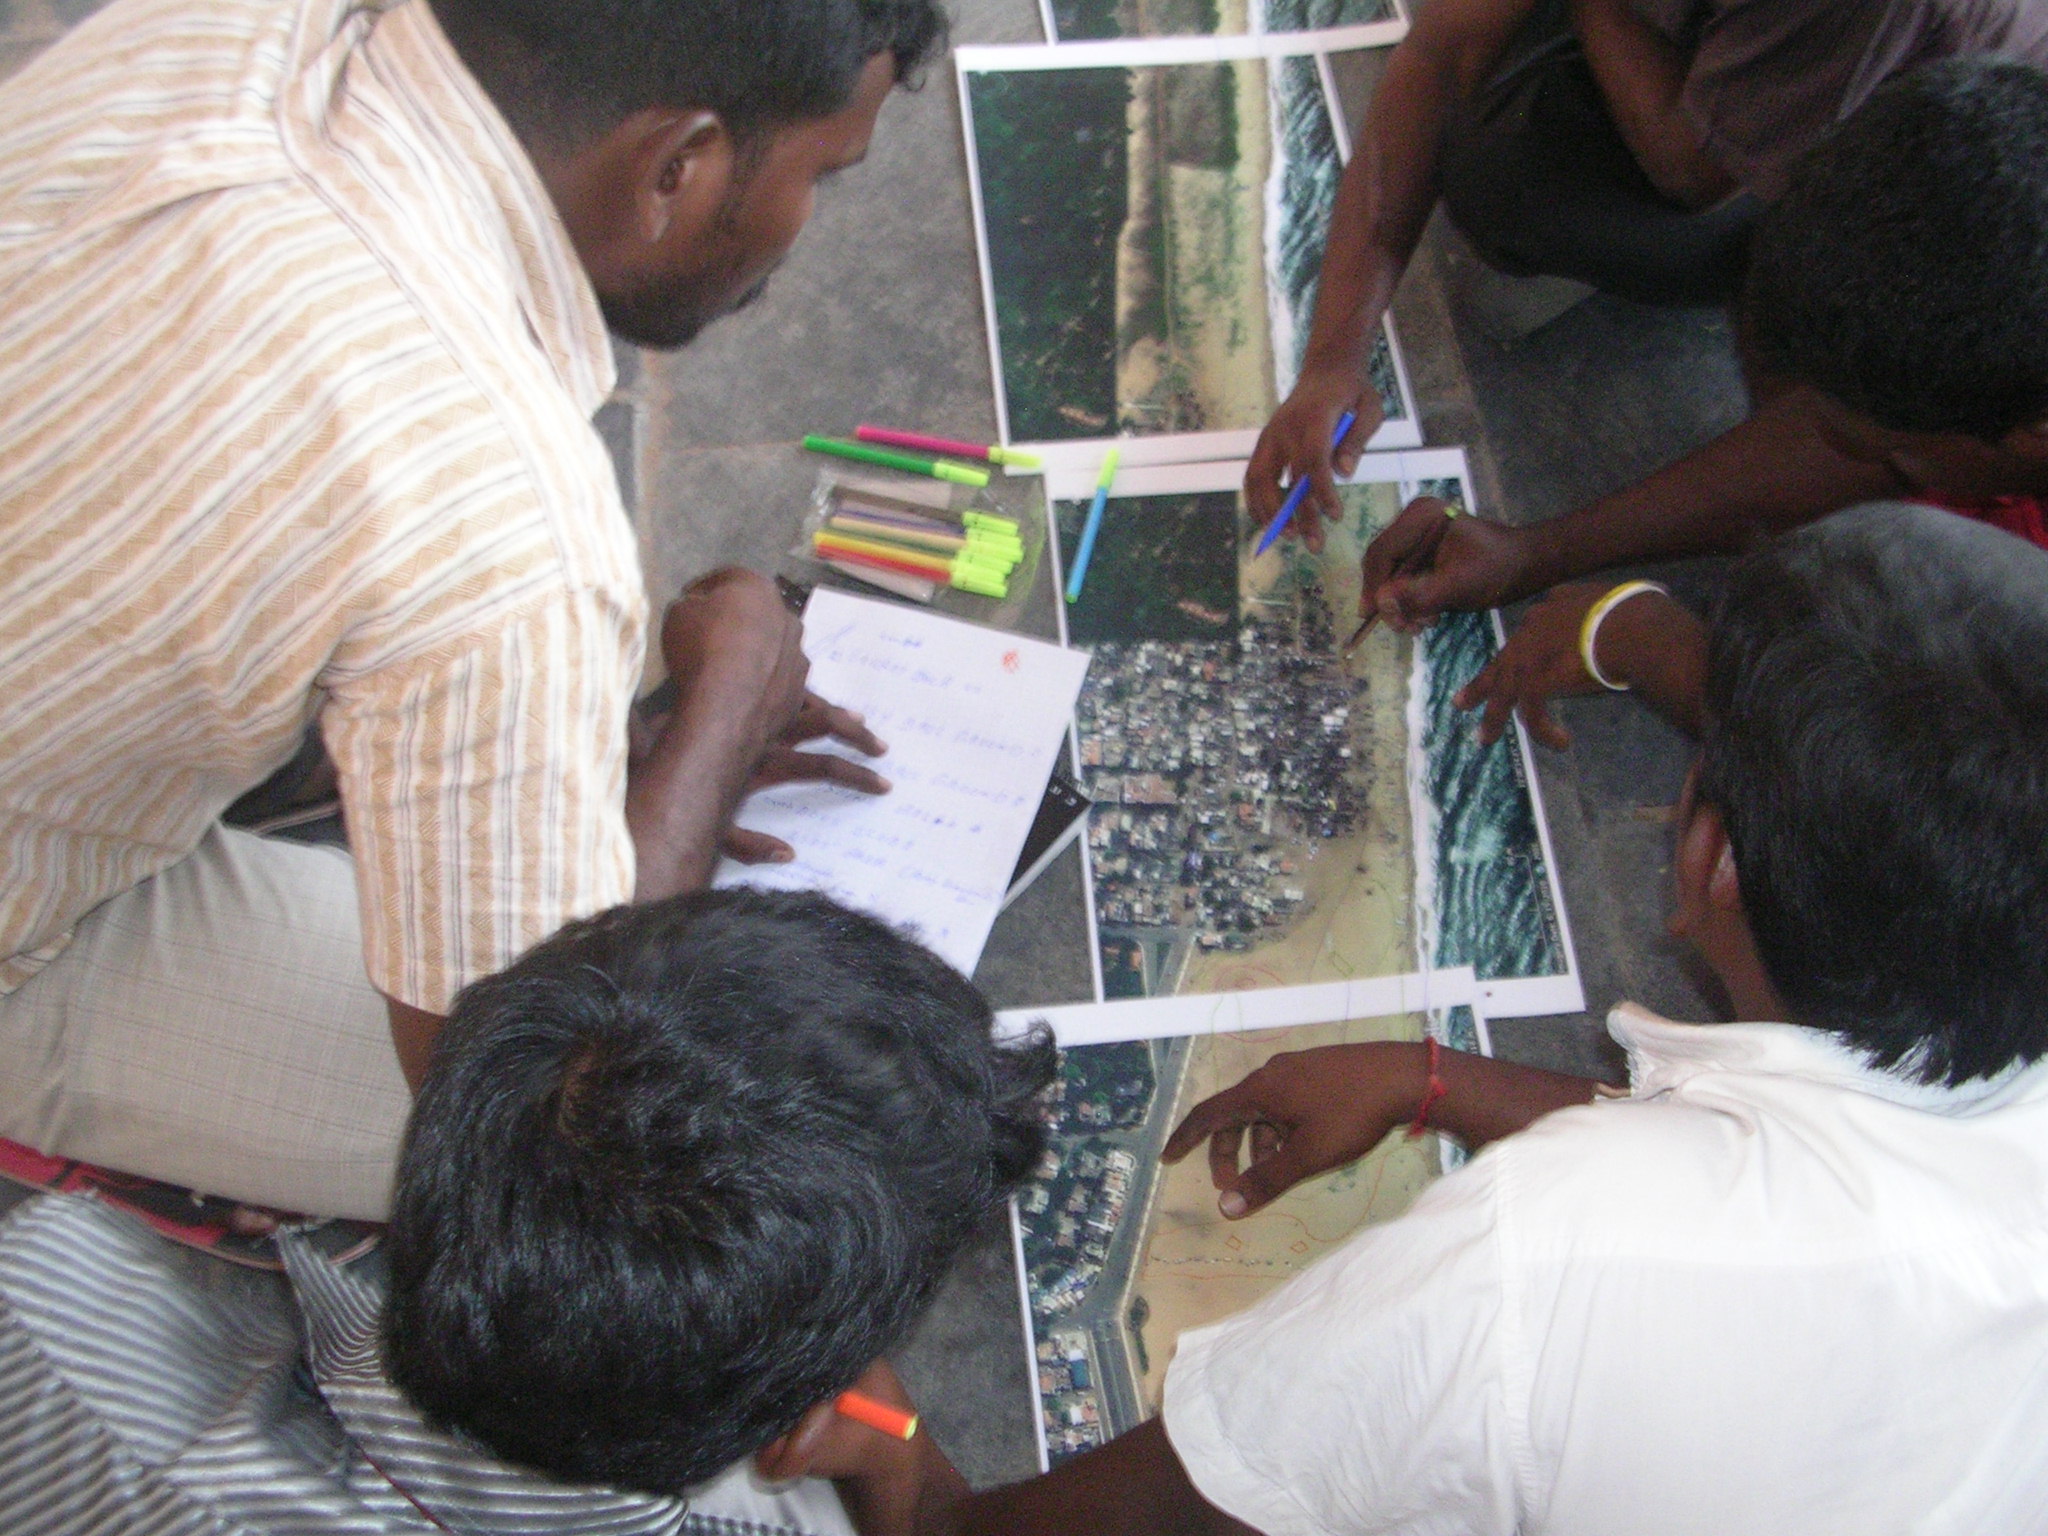
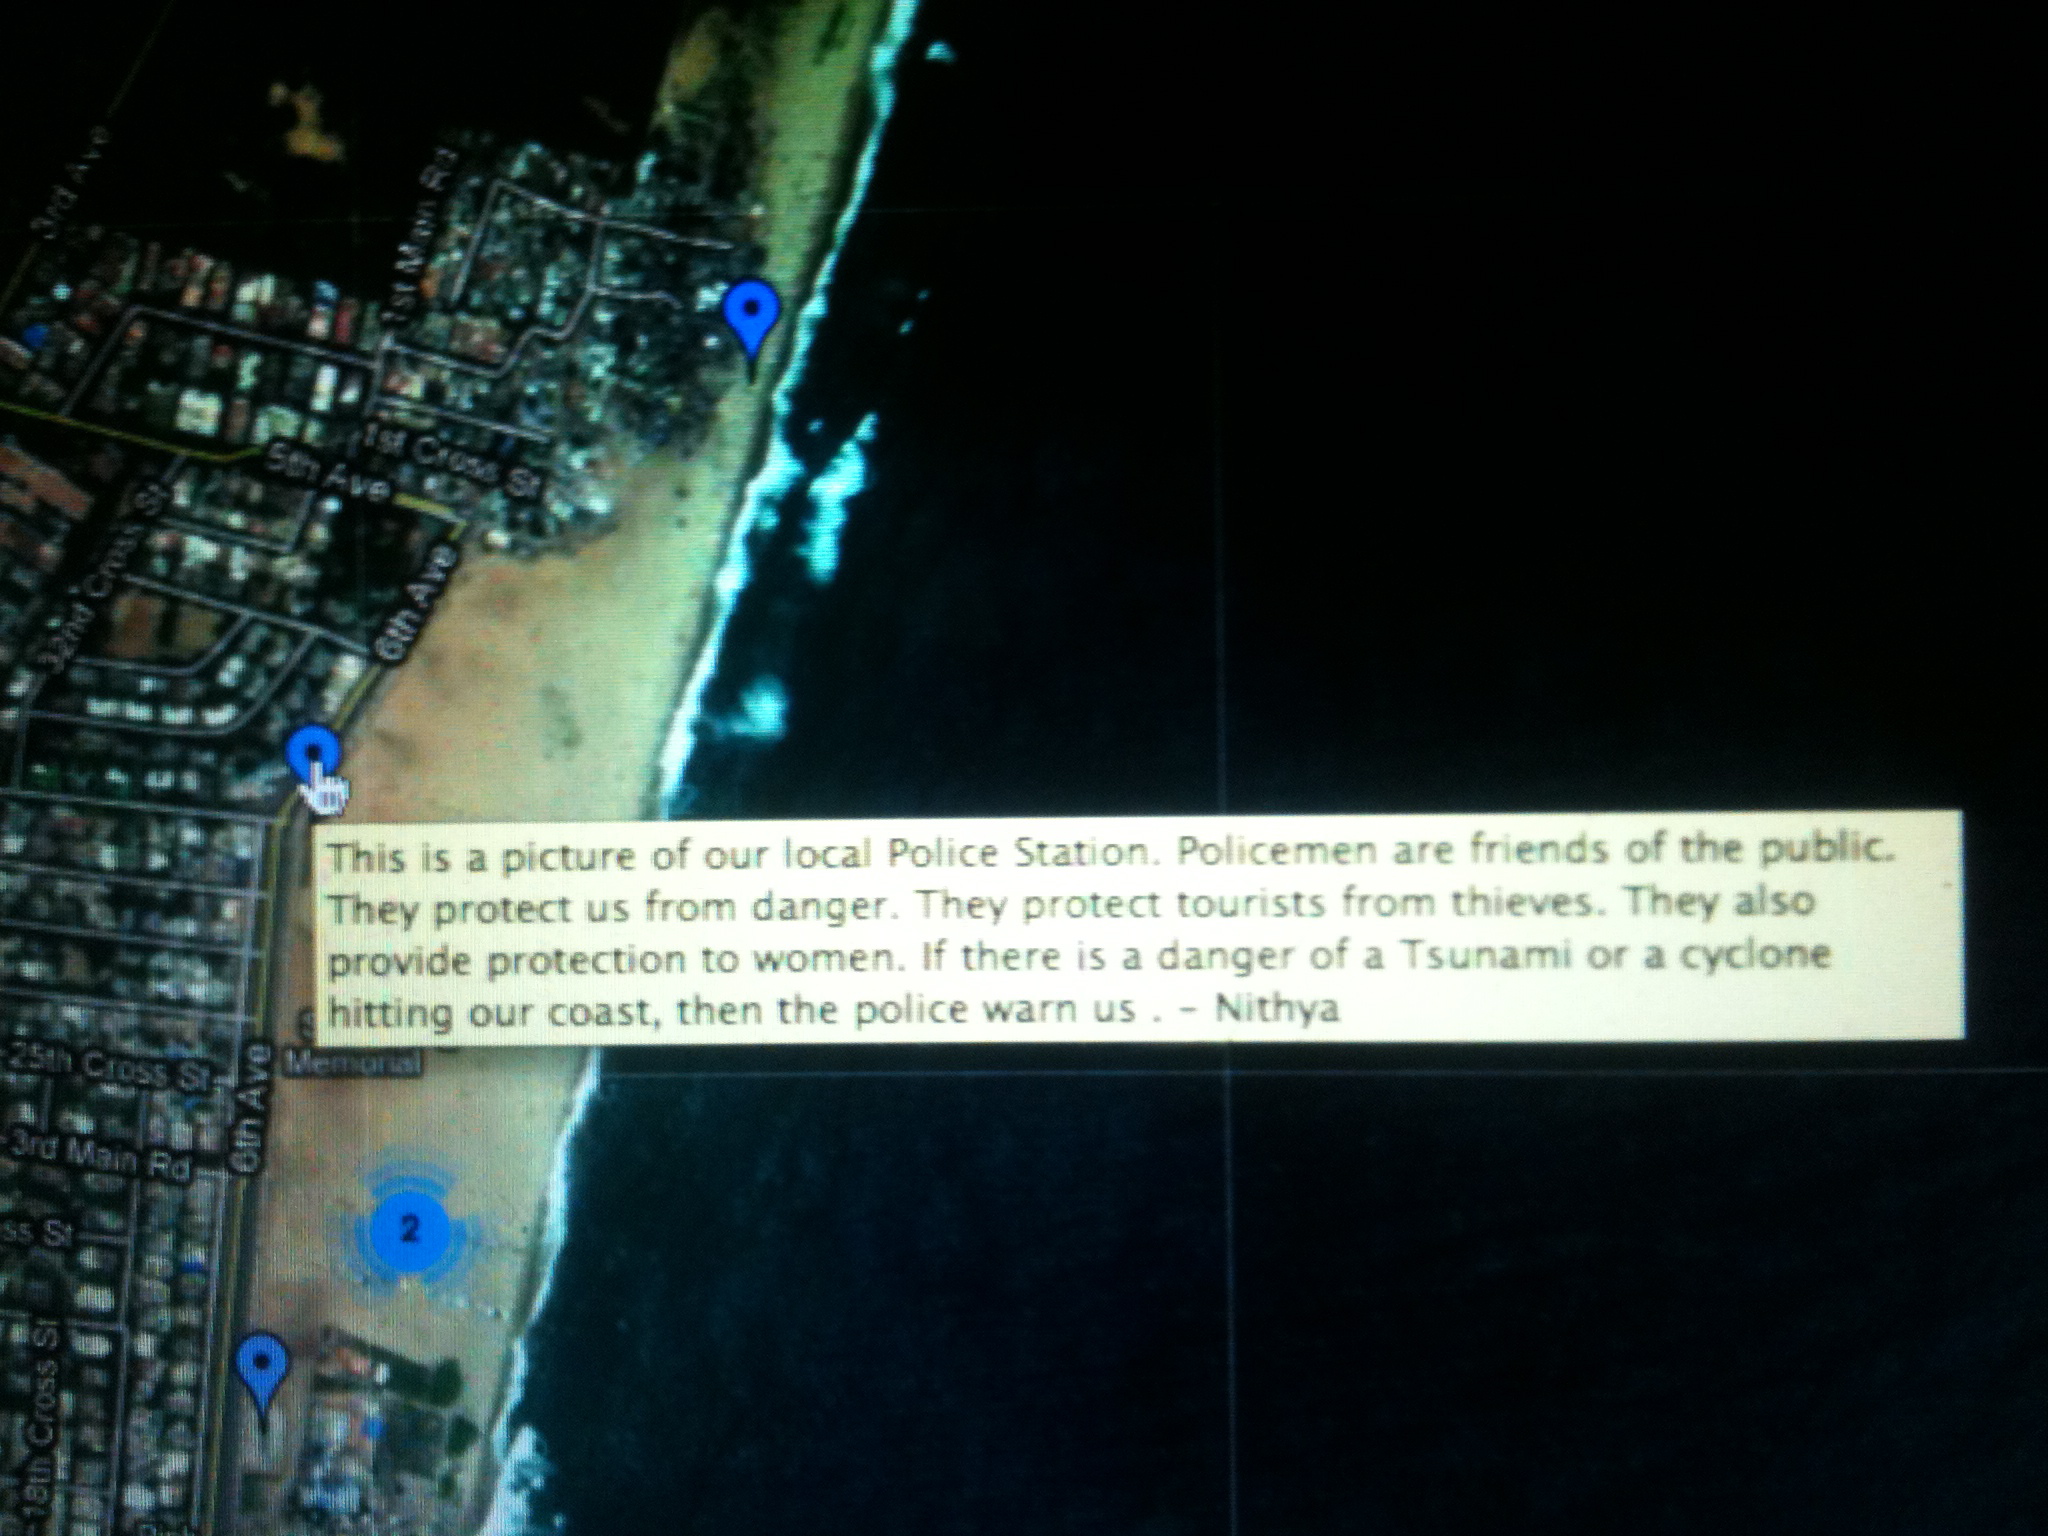
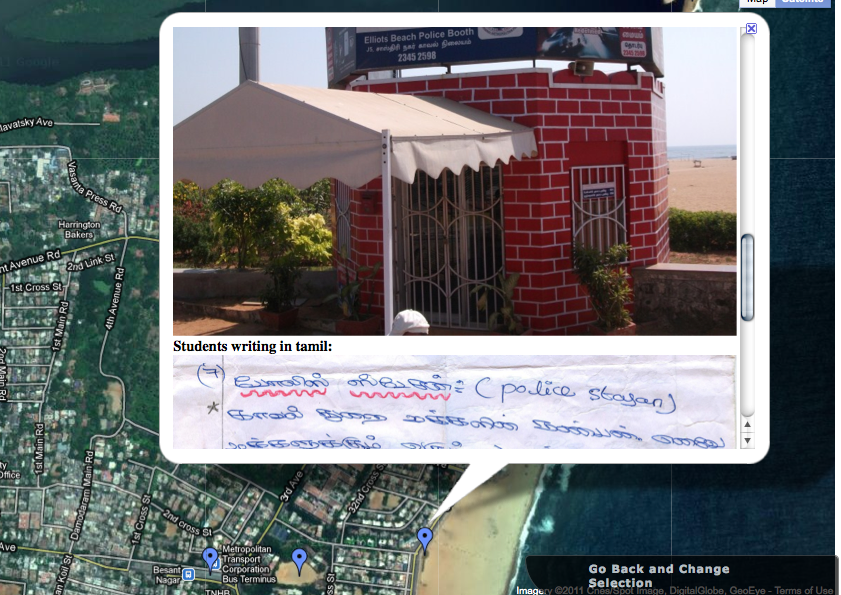
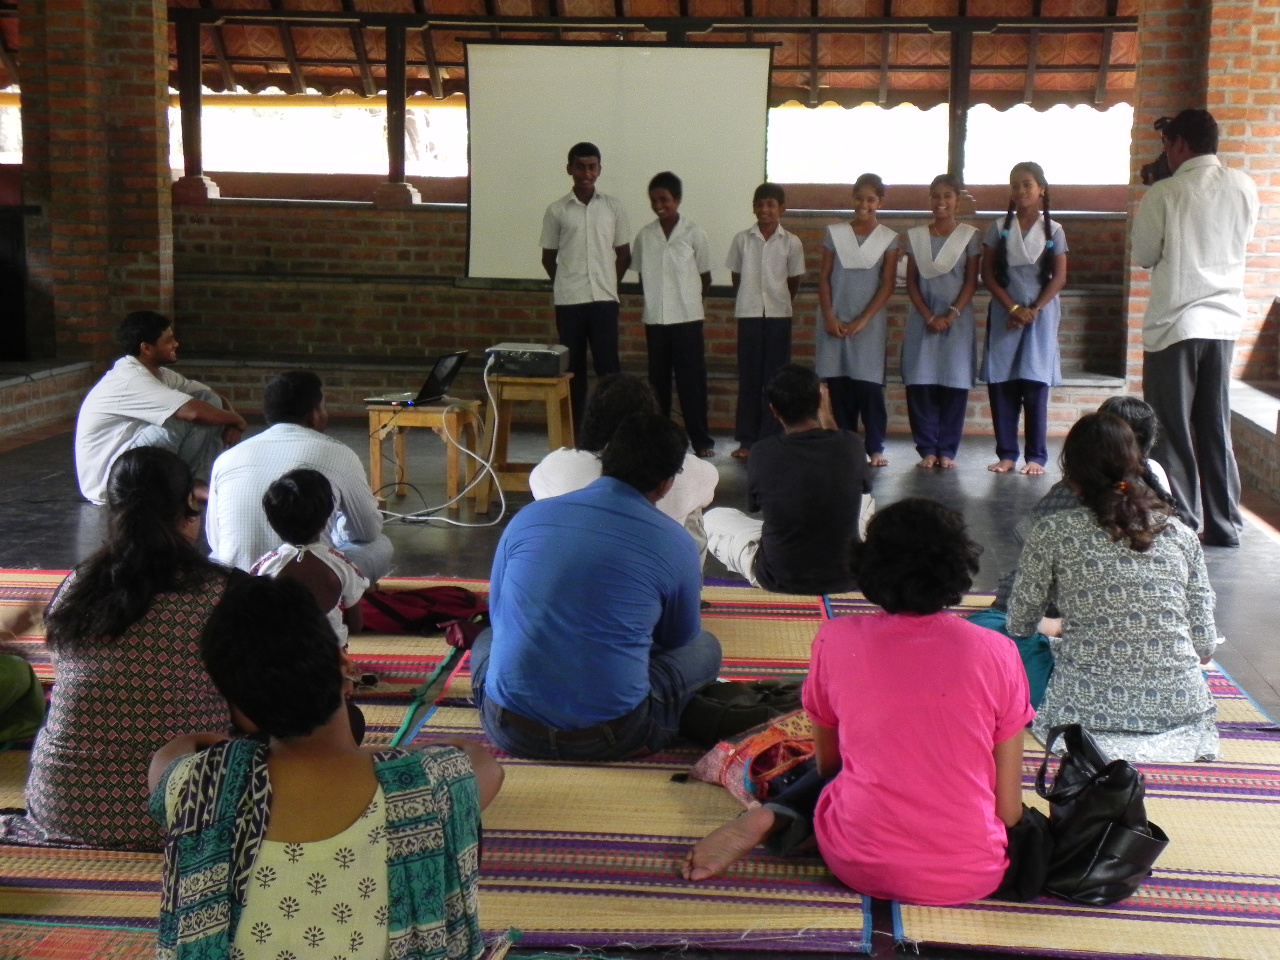
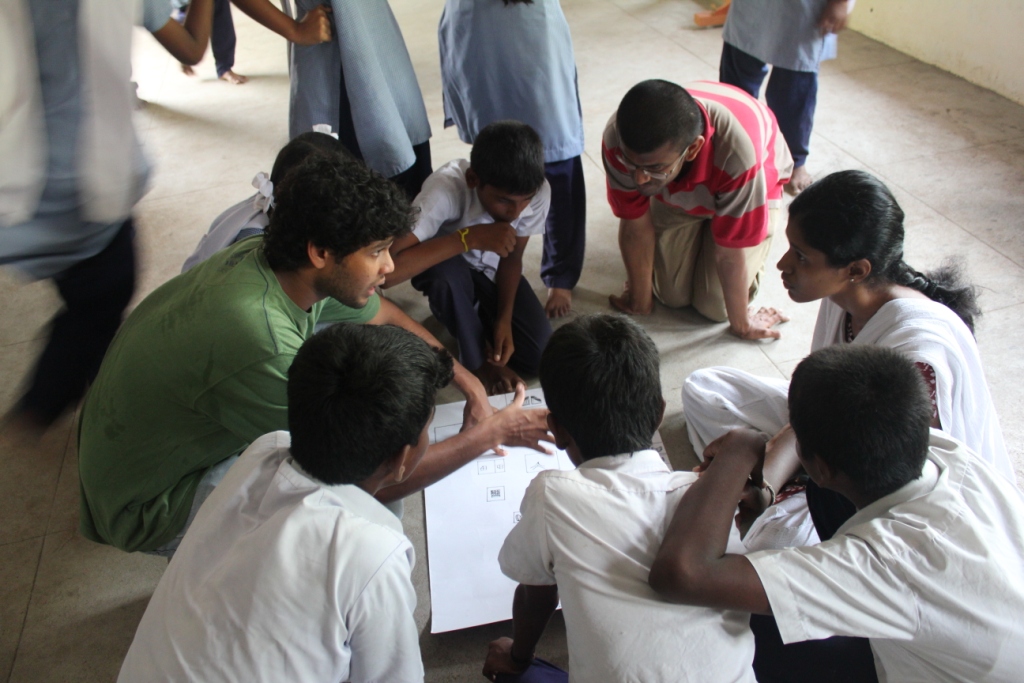
These rough maps were then taken back to the Kuppam and presented at a public meeting to see whether the community was happy with how it looked and whether they wanted it to be changed in any way (extend something here, shorten something there…etc). Also, since maps only work when it has context as well as auxiliary text, the public meeting served as a great place to get this data. The question that was asked was what would you like on your map? To facilitate this discussion we provided prompts on the map that the residents from the Kuppam could use to begin deliberating what text they wanted to see on the map.

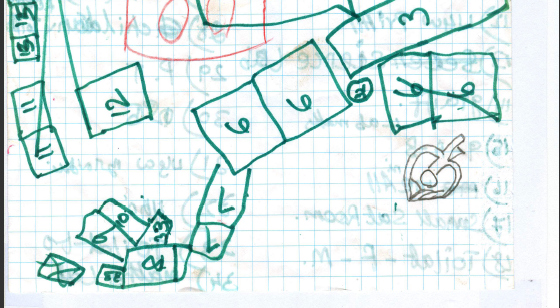
This discussion was an amazing experience and what emerged was hand written text (on paper and on the rough maps) that had information that we had to put in each map. Back to the office! (please see the English translations of the data)


English translations of data-

General Information about Urur/Olcott Kuppam (Welcome to Urur/Olcott Kuppam)- map 1

About Our Community:

This Kuppam comes under the Urur/Olcott Kuppam Panchayat. The Panchayat is made up of members from this community and it is a tradition for us to govern ourselves. Our ancestors are amongst the first residents of this area and fishing is our main occupation.

Role of the Panchayat:

The symbol of our self-governance is our Panchayat and there are many roles that it plays. For example:

-  It is responsible for intervening and resolving family disputes

- It is responsible for the health and well being of our community

- It is responsible for maintaining our temple property

- It is responsible for the inclusion of new fishermen into the fishermen cooperative

- It is responsible for making sure that government measures and benefits reach the people efficiently.

The Urur Kuppam Panchayat has around 255 members while the Olcott Kuppam Panchayat is around 210 members strong.

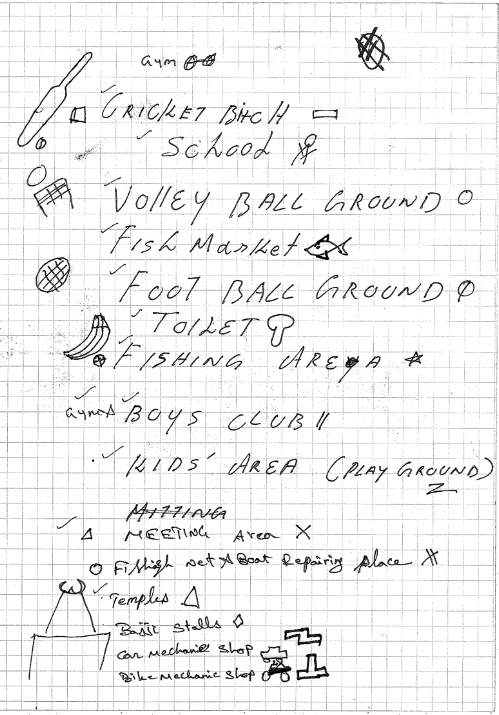
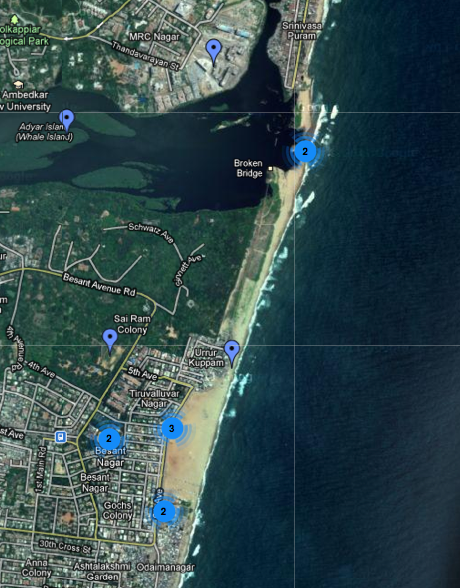
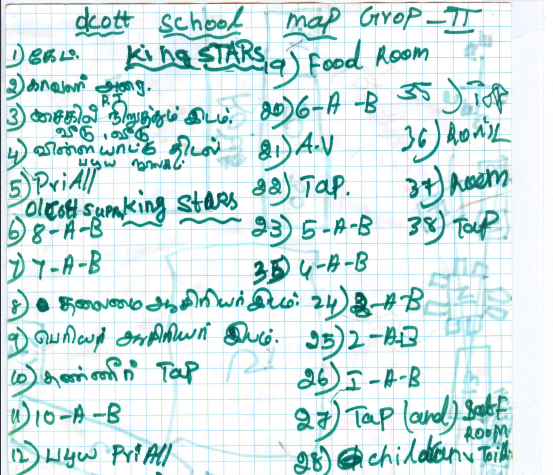
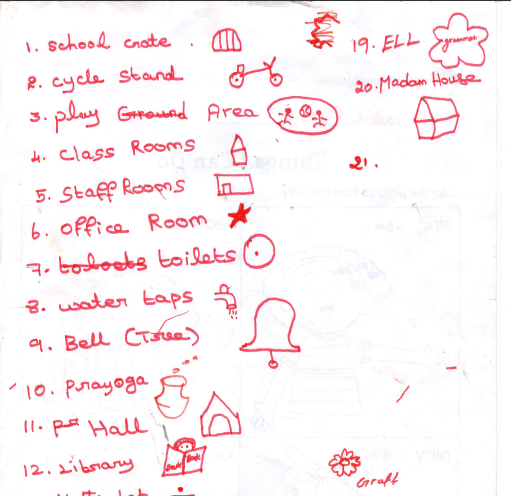
Infrastructure and Gaps Map- map 2

This map explains the existing infrastructure in our kuppam and highlights major problems that our community faces due to the lack of some basic and essential facilities. Following are the major infrastructure gaps in our community.

Playground:

There is no playground in the Kuppam neighbourhood. The nearest playground is too far away, which is the corporation playground seen on the map. Because of this a lot of the times our children resort to playing in front of the local temple.

School:

There is a functioning School, the Olcott school, run by the corporation. This School offers courses upto the 8th Std. However, from this year onwards, courses will be offered only upto the 5th std.

Bus Stop:

There is no bus stop near the Kuppam. The nearest stop is the Olcott Memorial School Bus Stop, which is on 3rd avenue. We feel this is quite far away.

Community Hall:

There is no Community Hall/Self Help Group (SHG) Building. We want a space for community activities behind the Building reserved for the Anganwadi Mid-day meal scheme.

Toilets:

There are 3 public toilet facilities. However, only 2 of these are currently functioning. The toilet in front of the temple is non-functional.

PDS Office (Ration shop):

There is no PDS shop in the Kuppam area. The nearest shop is in Besant Nagar.

Hospital:

There is a Government Hospital near the Besant Nagar Bus Depot. Doctors are available 6 days a week from 9 am to 2 pm. However, we also have to visit private hospitals like Santhosh Hospital and VHS Ho because the government hospital has inadequate services and closes early.

Fish Market:

While we have a fish auction area, we want a larger space to sell our daily catch. The current space reserved for the fish market is too small.

Garbage Infrastructure:

For a number of residents on the eastern side of the Kuppam (see map) the corporation has failed to provide a functional sewage connection. Becasue of this sewage from our homes collects on the beach and adversely affects our groundwater. It also is responsible for spreading disease.

Sewage Infrastructure:

There are not enough garbage dumpsters at the kuppam, which results in trash accumulating on the beach. Furthermore the Corporation of Chennai hardly comes to our area to collect this waste, which affects the cleanliness of the area. In 2010 after fighting with the Corporation they promised to provide waste disposal services more regularly. However, it did not last long and currently the corporation’s garbage trucks do not come into the Kuppam regularly to remove waste.

Socio cultural Map- map 3

This map shows the socio-cultural activities of the residents of the Kuppam. It highlights the importance of the coastline for our community because it is this space that is mainly used for our recreation and cultural activities.

Sports Clubs:

We have two main clubs at the Kuppam through which are responsible for organizing sporting tournaments. They are the Tiger Guys and Alexander.

Cultural Activities:

There are two main festivals that we celebrate. They are-

Sri Elliaman Koil Festival:

We celebrate this festival during Adi Masam (July- August). It takes place on the 9th week of this season from Friday to Wednesday. Every evening during these 6 days we have different functions. Sunday is the day we carry our idol around the village. It is a festival that is comomn to both Kuppams and is our most important festival.

Pongal festival:

During this festival we celebrate by conducting many activities for the children in our community such as Kolam competitions, running races and so on.

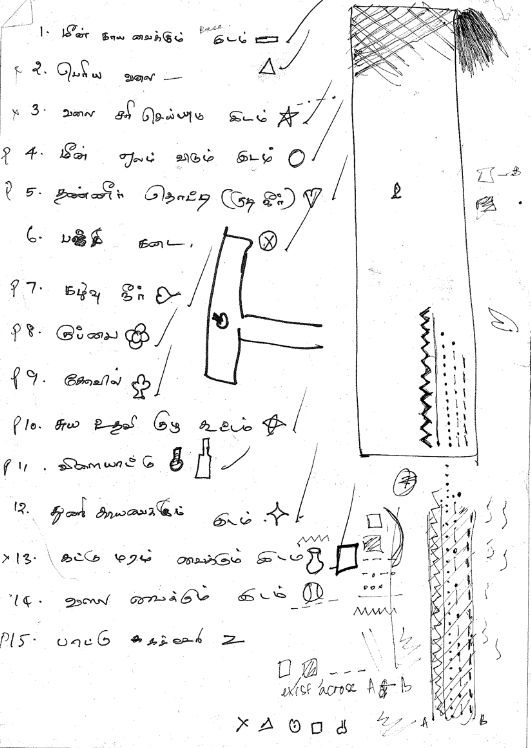
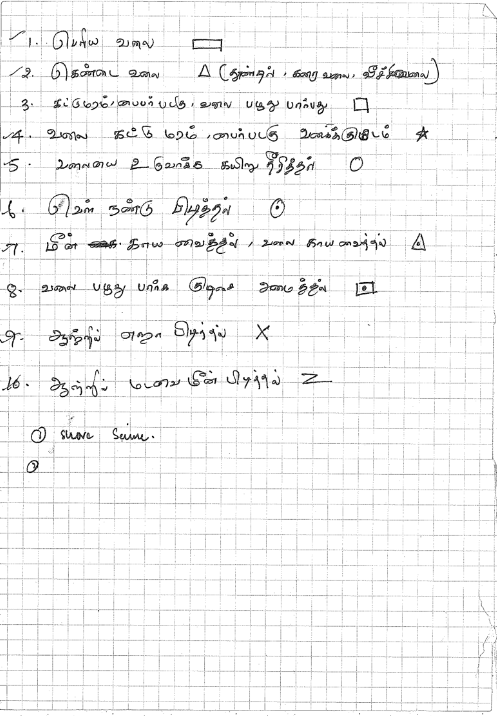
Livelihood map- map 4

We are people who belong to the neithal (seashore) land. The sea and the regions around the sea form the basis of our life. This is why fishing forms only a part of why the coastline is important to us.

This map highlights the different uses, and areas of the of the coastline that is important in our day-to-day lives.

Area used for Periya Vaalai (Shore Seine):

It is a really old tradition in our community. It involves not less than 30 fishermen at a time. It encourages the concept of collective fishing and is one of the main reasons for unity in our community. We use it only during the months of January to March. It is used to catch all kinds of fish.

Bajji Kadai (Vendor Stalls) Area:

It is one of our most important livelihoods. Our shops operate between 5 PM and 10 PM.

Shore and Estuarine Fishing Area (1):

Kendai Vaalai:

It is a type of net used for shore fishing. We go from the shore to a particular distance into the sea with the net. We then cast it and come back to the shore and walk along the coast, dragging the net in the water to catch the fish.

Thoondal:

We use baited hooks placed on a rope are cast from the sea shore and river banks to catch fish.


Net Preparing & Drying Area:

Net Preparing:

Though the nets are bought It needs to go through a process before it can be used in the sea. We first stitch rope on all sides of the nets. Then on the ropes in specific gaps we stitch thermacoal and pieces of copper alternately.

Net Drying:

After every days work we dry the nets to keep it safe. Because we use the nets everyday in the sea we cant leave it wet because it may tear.

White Crab Catching Area:

We catch white crabs in this area.We use it to bring small worms and insects out from the shore which we catch and use as bait to catch bigger fish in the sea. The white crabs can also be sold or cooked and eaten by us.

Madava Fish Catching Area:

Madava fish is caught in the river banks and sea and is abundant throughout the year. It is caught mostly on the banks of the river but during the rainy season we catch it on the shore. However, because the river is polluted it is now available only at the estuary.

Prawn Catching Area:

We catch prawns at the estuary, which we store in a box. This is then taken to the deep sea and used as bait to catch fish like Vanjuvam, Seela, Paavai, Vaval and Suuvai.

Katamaram (Catamaran), Fibre Boat and Net Storing Area:

Catamaran boats are our traditional boats. However they are difficult to operate in the deep sea. Some people still use them to fish. Fibre boats are the easiest way to fish and is fast and effecient.

Kattamaram (Catamaran) Fibre Boat and Net Repairing Area:

When these boats need to get repaired, we build small a small hut and do our work. Also, everyday after fishing we need to tend the nets. This is because when the fish is taken out, along with the shells and crabs the nets tear. We repair these small tears everyday so that we can go for fishing the next day.

Shore and Estuarine Fishing Area (2):

Veechu Vaalai:

We cast this kind of net from the shore when the tides are high in the river and sea. It is also used on a regular basis.

Kondai Vaalai:

This is mainly used where the river meets the sea. It takes 4-5 people to work this net. One person watches for fish and when spotted the net is raised. It is used to catch prawns and crabs. It is also used all along the coastline

Fish Drying Area:

Fish like Kavali, Vali, Mathi and Sena Kenu are found in large quantities in the sea which we catch. The excess fish is dried so that it can be sold or used by us during the rainy season.


Community Mapping at Urur/Olcott Kuppam- Step 1… in pictures

The biggest advantage that Transparent Chennai has in trying to facilitate the creation of a community generated map from Urur/Olcott Kuppam is the fact that a good friend of mine lives there and is a member of the Urur Kuppam Panchayat. His name is Saravana and he has been instrumental in organizing support and creating awareness about our initiative. I don’t have a picture of him as yet but I will put one up in the next blog post, which will feature his views on why he thinks the maps that we make will be useful for his community. It was based on his knowledge of the community that we decided to conduct mapping sessions with individual groups- the fishermen, the women and the youth to get a more comprehensive picture of all the activities at the Kuppam.

Step one included writing a proposal and getting it signed and approved by the Panchayat body and meeting individuals from the three groups. Convenient times to meet were discussed and we met with each group separately. During the meeting the groups deliberated on what they wanted on the map writing a final list, which was then coded with symbols (this became the Key). Participants from each group drew over google images of the coastline, which were printed out on A1 paper to display what was there and how they used the space around the village.

Proposal that was signed by the Panchayat:

Mapping on A1 google map printouts of the area:

Fishermen group mapping using google images as a base layer

using the key that they made

Keys that were created:

Womens group Key

Fishermen group Key

Youth Group Key

Translation of women and fishermen group keys

How some google image printouts looked after it had been drawn over:

Work of the womens group- image shows area just outside urur/olcott kuppam

same group- image shows the public beach just south of the Kuppams

image along with the key taken at the Transparent Chennai office.


-Siddharth Hande

Press coverage of the Olcott Mapping Workshop Public Meeting

Here are a few links to the press coverage that we received after the public meeting where the kids from Olcott School displayed the work they had done!

The Hindu-

http://www.thehindu.com/news/cities/Chennai/article1761975.ece?service=mobile

The New Indian Express-

http://expressbuzz.com/cities/chennai/kids-learn-mapping-to-know-their-surroundings/268430.html

The Times of India-

http://m.timesofindia.com/PDATOI/articleshow/8068515.cms


We plan on doing many such workshops in the near future!


-Siddharth Hande


Harnessing the power of maps to lend voice to the voiceless- the case of the mapping workshop at Olcott Memorial School

I think a great way to understand the importance of community maps and participatory map making in general is to first understand its relational and political nature. For instance, did you know that community mapping has been banned in Malaysia? This followed a landmark court victory where a community made village map was the key piece of evidence used to prove customary rights of communities living in Rumah Nor! (for more please see http://www.nativemaps.org/node/1715)

How did this kind of map-making, which involved a piece of paper, a few sketch pens and possibly some help from satellite imagery become so powerful that it elicited such a response? This question prompted me to do a little research and I found a brilliant book called ‘Rethinking the power of Maps’ by Denis Wood, which helped shed a little light on the subject. The following section is informed primarily by his insights on the subject.

What are maps?

Although unaware of a definition, all that I knew about maps were that it was used to show where things are (recalling what I had learnt in school!). That is, it represented what was in an area spatially and was sorted based on particular themes (political maps show states and capitals, physical maps show natural features).

This seems to be in line with common understandings of maps if we take into account figure 1 which is a ‘word cloud’ generated using Jonathan Feinberg’s ‘wordle’ algorithm, out of all the words in the 321 definitions of the word ‘map’ collected from 1649 to 1996 (definitions compiled by J.H. Andrews, see Andrews 1996, also see http://makingmaps.net/2008/11/25/321-definitions-of-map/ and http://www.wordle.net/).

The size of each word is proportional to its frequency in the collection of definitions.

So according to most definitions, maps represent the earth’s surface. But does it really? Wood (2010) begs to differ. Through a histographical analysis he notes that the rise in the importance of maps in newly forming states was because officials began to realize that maps helped in giving form to the state. That is, maps had the ability to help construct the state.  Talking about the reason behind newly forming states fascination with maps he comments (2010: 33)-

‘…it certainly cant be the maps putative ability to ‘represent a part of the earth’s surface’. After all, it was the maps that conjured up borders where none had existed (especially well documented for the United States, Russia and Thailand); the maps that summoned unity from chaos (like Japan and Russia); the maps that enrobed the shapeless(as in the case of China)…maps that endowed with form what from the beginning had been no more than a dream… “We no more show what exists” said the maps(even today they say this about the borders of India and Pakistan, Israel and Palestine, India and China). What maps thereby avoided saying was, “Exists, yes, but only on these maps which, in fact create and affirm their existence,”…maps created and affirmed their own existence, most effectively by hiding their own recent origins…in the state itself’.

From this analysis thinking of maps as merely representations of the earth’s surface is specious. Instead, we need to ask ourselves whose ‘surface’ do most maps represent?

For example, we are familiar with this map of Australia-

Map 1- Political map of Australia

However, how many of us have seen this one?

Map 2-Aboriginal Territories of Australia.

Is Melbourne really in Victoria or somewhere in between a mesh of aboriginal territories?

Do the smooth lines and clear demarcations of the political map negate the squiggly lines that define the age-old territorial formations of the original inhabitants?

The answer is most likely yes (unless you are an aboriginal inhabitant!).

Thus one needs to consider the power of maps in reaffirming the hegemonic beliefs in a region. This is true even for user-generated maps like google! After all, before someone can begin plotting away on a google map isn’t it a precondition for that person to be Internet saavy?  However, what is also clear in the case of Rumah Nor is that the power of maps can also be used to affirm the presence of alternate subaltern realities (which is precisely what the officials in Malaysia seek to deny!). For an amazing initiative in this vein see www.nativemaps.org.

Maps need to be viewed with a healthy skepticism that allows the map viewer to move past the common misconception that maps are representations and into a realm where the viewer is aware that what maps ‘represent’ is mostly in thrall of the dominant interests.

For me, the fact that maps are rhetorical tools became most visible during our mapping workshop in Olcott School where the kids debated constantly on what they would like on their map and how it should be represented, with each debate leading to subtle changes in the maps presentation. Also, in an effort to use maps as a tool to understand how the kids viewed their surroundings beyond their school, we gave them google images of the surrounding area and asked them to take pictures and write about what they found interesting in different areas. While the best way to have done this would have been to let the kids choose the areas themselves, unfortunately, because all the kids were not used to navigating using google images we familiarized them with the tool by marking places of interest and taught them to use roads and other identifiers to locate these areas. This is a quick screen capture of the areas that were marked. Placemarks marked 2 and 3 when clicked, reveal more locations.

The resulting map tells us a story, and provides insight into how these children visualize these spaces.

If the placemark is clicked, it reveals the photo that was taken and the original writing in Tamil.

To look at all the photos along with what the kids said, please visit http://www.transparentchennai.com/buildamap/olcott.php

Finally these maps were used to tell the children’s story in a public presentation made by the kids.

What stories will the maps made by Urur and Olcott Kuppam tell? What conversations will they start between the Kuppam, the general public and the authorities? While we can’t know for sure, we do know that the maps will help in at least ensuring that these conversations are less one sided.

-Siddharth Hande

How the Students made their map!

Want to know how the kids from Olcott School made their map?  Our intern, Neha Joseph tells us how!

Creating maps in 3 simple steps!

Step 1: Taking a few sheets of blank paper and orienting themselves using the school gate as a reference point they walked around their campus and marked out every building/structure/area that were important enough to be on their map.

1: part of a rough map belonging to one of the student groups

The markings mainly consisted of polygons and inscribed in every polygon was a number, which corresponded to that locations description.

2: information about locations

For example, according to this map the number six corresponds to sections A and B of class 8.

Step 2: After finishing their survey, the four student groups reviewed the information that they collected and began to group together certain numbers, which they thought were similar and based on discussion, assigned these groups with particular symbols.

3: A ‘key’ made by the students

For instance class 8, class 9, class 10 etc were all grouped under classrooms with a particular symbol used to describe it.

Interestingly, as the process of making the key was deliberative, there was an intense debate on what symbols would best represent certain locations, which resulted in a great discussion amongst the students.

4: students use paper to figure out how their symbols should look

Step 3: Finally, with chart paper, felt tip pens, rulers, erasers, pencils and more the children created their final map!

Do you think this map is a ‘legitimate’ representation of their school? What are the uses of such a map? More insight on this along with information about the children involved in this project coming soon!

- Neha Joseph

Using participatory mapping to help fishing communities lay claim to their coastline

The city of Chennai was created when the British acquired a three-mile long strip of land, including a fishing village called Madraspatnam. Fishing communities were here before the rest of the city, but today, in both legislation and in public perception, these fisherfolk are deemed trespassers on the very beach they’ve called home for hundreds of years. One path that can help rectify this frailty is by creating locally generated maps that allow us to understand the relationship of fishermen with the coastline, and to use this data to craft legislation that ensures that fishermen have access to the land they need for their lives and livelihoods on the coast.

In India, there are around 3202 marine fishing villages, with 591 of these located in Tamil Nadu alone. Fishing communities have evolved well functioning internal governance institutions, fishermen’s panchayats, which oversee and manage the common lands of the community.

Yet, studies indicate that clearly stated fisher folk rights even for basic provisions like titles and deeds for their houses and settlements are yet to be addressed properly. In fact, it was only when the Coastal Regulation Zone (CRZ) Notification of 1991 came into force was any acceptance given to customary land rights for fishermen at all. However, due to the lack of clear definitions the CRZ has failed in truly empowering fishing communities. For example, the CRZ states that “traditional” communities have the right to be on the coast. But what exactly defines a “traditional” community? As soon as we begin to create parameters for this definition we hit roadblocks. For instance, the age of the community alone cannot be used as a determining factor on whether a community is ‘traditional’ or not. This is because over time, many new villages in different locations on the coast have been formed by traditional fishermen who have moved out of their parent village due to factors like congestion and overcrowding. It would seem the best way to define a traditional community would be through an analysis of its livelihood, social and cultural practices. However, with no guideline data to make comparisons with, ‘traditional’ is still a term open to interpretation. More controversial still is that the CRZ notification places the power of interpreting these parameters in the hands of the State and District Coastal Zone Management Authority, which are both government agencies that presently have none or negligible representation from the fishing community. The recently passed CRZ Notification of 2011 has done nothing to rectify these problems.

In the city, fishermen have fared even worse. Their lands were classified as “slums” under the Tamil Nadu Slum Clearance Act, 1971 and control over the lands was given over to the Tamil Nadu Slum Clearance Board, with land title allocations not carried out in a comprehensive manner. This has led to a situation where the government has the power to relocate fishing communities wherever they wish without any consideration given to fishermen’s livelihoods, something that the fishermen of Srinivsapuram faced after the tsunami.

Sadly, people’s perceptions of urban fishing hamlets, post government reclassification, has followed suit. How so? Well, what seems to have happened in recent times is that, to the general public of Chennai, the word kuppam, which just means fishing village, has became synonymous in our city with slum. The discourse surrounding the word kuppam has coalesced with common discourses surrounding slums (think dirty, clandestine, dangerous, unproductive, encroachers).

So what needs to change? First of all, it is imperative that concerted steps be taken to gather data that can help in understanding the customary practices of fishing communities on the beach. Secondly, proper information about the landuse and customary practices of fishing communities should be used to reformulate the laws to ensure that these lands are reserved explicitly for fishermen. Such a law would go a long way in empowering them to counter threats from rapid development.

In urban fishing hamlets, the creation and exhibition of such data will also serve as a positive step forward in creating awareness amongst the general public on the activities of the fishing community, and their historic place in the city. This kind of data collection will also do well to remind beachgoers that while they perceive the beach as a public space to be used for recreation, fishermen have long negotiated the coasts as a home and a place to work.

Through locally generated maps, we aim to do our part in rectifying the enormous lack of data on fishing communities. We believe that this technique, known as ‘participatory mapping’, is also one of the best ways to do this because unlike other data gathering processes, the initiation and ownership of the data will rest primarily in the hands of the local panchayat and residents.

Based on preliminary meetings held with kuppam residents and the panchayat it has been decided that three kinds of maps will be generated- those that provide information on landuse, on local infrastructure and those that provide locally generated demographic information on the community.

We are very excited at the prospect of helping create locally generated maps, and hope to use the mapping exercise at Urur and Olcott Kuppam as a pilot study, so that we can extend this method of data collection to all the fishing hamlets on Chennai’s coastline.

-Siddharth Hande

Mapping their city

A guest post from our intern Anjney Midha, who helped us with the mapping workshops held in Olcott School

Little hands crease the white chart paper, as fingers clutching felt pens and crayons dart about quickly, outlining squares and other shapes. I catch glimpses of symbols and colors; a cricket bat occupying a large oval in one corner of the sheet, a pair of hands clutched in a Namaste in another, and a large mustachioed face under a label titled ‘Watchman’s booth’.

All around me, children of the eighth grade at the Olcott Memorial School in Besant Nagar are busy mapping out their school’s campus in groups, developing their own unique symbols and keys, color schemes and layouts. Working together, they turn occasionally to Shobha Narayana, their English teacher, and Siddharth Hande, TC’s workshop facilitator for help. By the end of the session, maps emerge, each diagram telling a story of its own.

Maps are wonderful inventions. As a means of communication, they are invaluable. As navigation tools they are indispensable. And as the creation of children, they are telling of human psychology.

Transparent Chennai recently concluded its Mapping Workshop at the Olcott School. The session was the fourth and last installment in a month long workshop focusing on teaching children the power and value of maps as spatial, political and information tools, and helping them to map their own environments.

In addition to developing the children’s mapping skills by allowing them to plot their school campus, the workshop also involved introducing the students to basic mapping technology, such as GPS, satellite imaging and Google Earth.

Perhaps the most interesting outcome of these workshops comes from comparing the hand drawn maps these children create. Each chart paper tells a different story, communicating nuances about each student’s life. One map is centred around a cricket pitch with sports symbols of volleyballs and soccer goalposts figuring prominently alongside. On another map, three students have meticulously drawn their classrooms, mathematical symbols representing their math lab, book spines iconizing the library and so on. On yet another map, the prayer halls are most dominant. The differences speak of innumerable nuances adults can only begin to guess at. Ask a group of adults to map their office, and the result is arguable predictable; here is the coffeemaker, here is the photocopier, that’s the washroom. And yet, with thirteen year olds, the activity yields diversity, bordering on art rather than science.

We often take for granted that maps are absolute, mere representations of fact. But our mapping workshop makes it clear from the perspective of children that maps are not simply a two-dimensional diagram, but arguments and dialectics, speaking to differences in land usage, lifestyle needs and spatial relationships. We look forward to working with school children in schools all over the city this coming school year to talk about maps, mapping, and representing space.

For more information about Transparent Chennai, check out our site at http://www.transparentchennai.com/

.